- 1
Deleaker detects all types of leaks: memory, GDI, handles, and more.
- 2
Deleaker works as a standalone application and tightly integrates with Visual Studio, Qt Creator, and RAD Studio (Delphi / C++Builder).
- 3
Deleaker supports all major compilers, including Microsoft Visual C++ and MinGW.
- 4
Deleaker profiles native and .NET code and supports both 32-bit and 64-bit applications.
- 5
Deleaker generates detailed reports and exports results to XML for further analysis.
C++ memory leak detection
Deleaker is an extension for all major IDEs and a standalone application for memory leak detection - memory, GDI, and handles so far.
Even the most stable of Windows applications are not immune to resource leaks. And of all the bugs and issues, memory leak detection tends to be the most difficult, especially when found in GDI objects and menus. And the golden rule of thumb is that the sooner bugs are found and dealt with, the less expensive they prove to be.
While there's no shortage of tools and add-ons to help track down memory leaks, few are capable of tracking GDI resource leaks that can devastate Windows performance. Deleaker is one of the few tools capable of this, and will have a minimal impact on your application's performance.
Deleaker is a memory leak detector that integrates with all major IDEs: Visual Studio, Delphi, C++ Builder, and Qt Creator.
Get 14 Day Free Trial
Enter a valid email address to receive the demo version.
If you don't receive the email, please contact us.
Deleaker finds all memory leaks and provides comprehensive allocation details
Regardless of the type of leaks, Deleaker finds them all: memory leaks (caused by heap, virtual memory, or OLE allocators, etc.), GDI leaks, Windows USER object leaks, and handle leaks.
For Delphi and C++Builder, you can also explore allocated objects.
For each allocation, the size, hit count, type, and full call stack are available to help you quickly locate the leak and fix it.
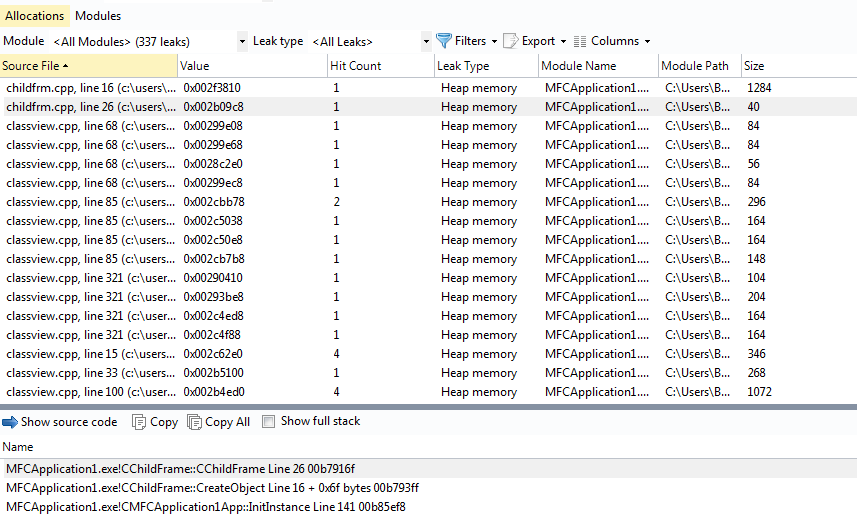
Deleaker integrates with Visual Studio
As a Visual Studio extension, Deleaker tightly integrates with your favorite IDE.
At any time, you can take a snapshot and explore allocated objects.
The latest Visual Studio 2026 is supported, along with earlier versions: 2015, 2017, 2019, 2022, as well as legacy versions such as Visual C++ 6.0 and Visual Studio 2005, 2008, 2010, 2012, and 2013.
Standalone version
Visual Studio is not required to use Deleaker Standalone. The standalone version can debug any application and display all current allocations. You can run it on a client machine that does not have Visual Studio or any other IDE installed.
By taking snapshots in real-world environments, you can later analyze them on a development machine to efficiently fix leaks.
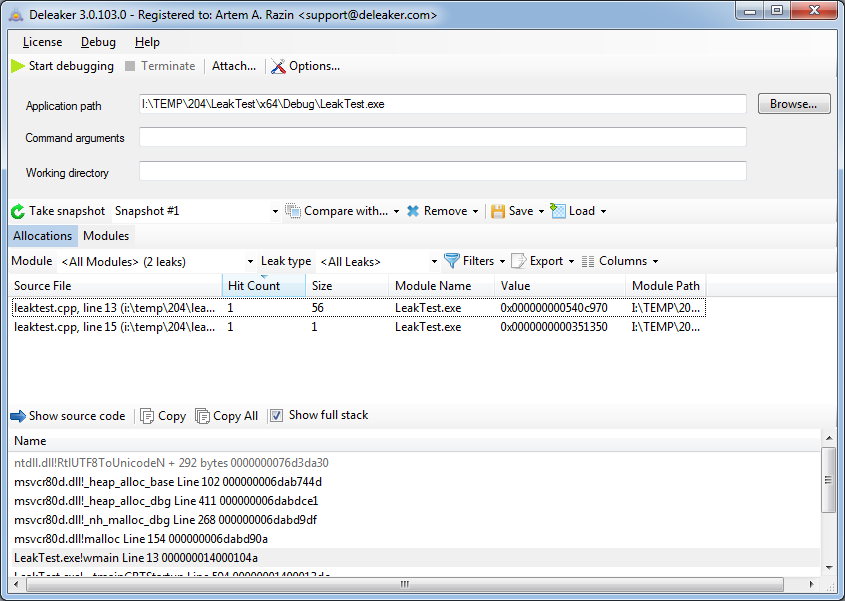
Integration with Qt Creator
Deleaker provides a plugin for Qt Creator to detect memory leaks in C++ and Qt applications.
When needed, you can explore allocated memory, GDI objects, and handles.
Navigate directly to the source code of a leak to fix it without leaving Qt Creator.
RAD Studio integration
Deleaker detects leaks in Delphi and C++Builder applications.
As an extension for RAD Studio, Deleaker displays allocated memory, objects, handles, and GDI resources.
Fix all leaks without leaving RAD Studio.
Trusted by developers worldwide
★★★★★
Based on real customer reviews on Trustpilot
Real feedback from developers who rely on Deleaker to detect memory and resource leaks.

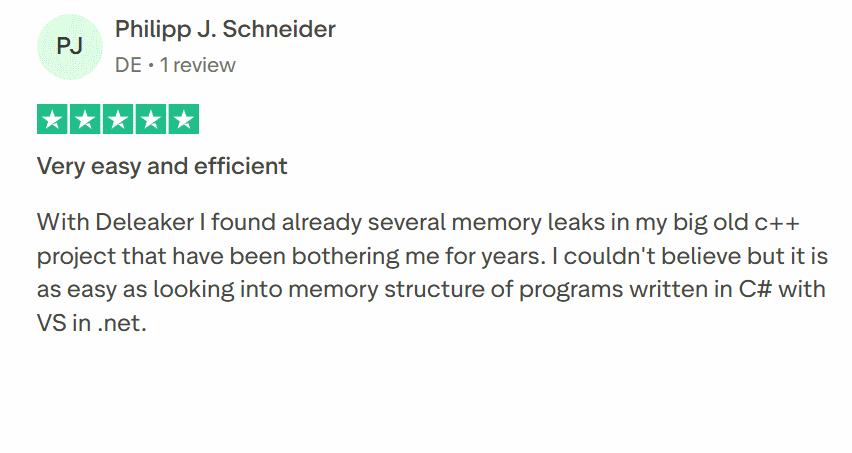
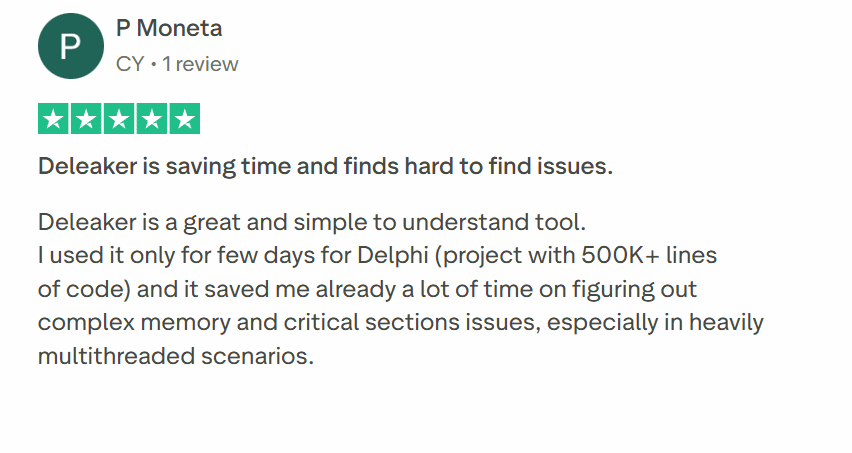
"The native profiling mode of Deleaker is extremely fast and this has made profiling/fixing memory leaks much faster than with our previous memory profiling tool."
C++ Developer
Want to see Deleaker in action?
Enter a valid email address to receive the demo version.
If you don't receive the email, please contact us.
Try Deleaker without limitations
The demo version is fully functional for a 14-day period.
Download the demo version, which includes the standalone profiler as well as plugins for popular IDEs such as Visual Studio, Qt Creator, and RAD Studio.