How to detect leaks in C++ Builder with the help of Deleaker
This tutorial explains how to find memory leaks in C++ Builder without leaving the IDE. You will also learn how to navigate to leak sources and compare snapshots in order to identify leaking code.
Even when modern techniques such as RAII and smart pointers are used, memory leaks can still occur. This is possible even without direct usage of raw allocation functions such as malloc, calloc, new, or delete. For example, circular references between smart pointers can easily lead to leaks.
In legacy projects, large parts of the codebase often cannot be rewritten using modern C++ techniques. Such code may leak resources and must still be analyzed and fixed.
Installation
Deleaker is available both as a standalone memory profiler and as a plugin for C++ Builder.
In some cases, leaks can be reproduced on a client machine but not on a developer machine. The standalone version of Deleaker is designed specifically for such scenarios.
For everyday development, it is recommended to use Deleaker as an IDE plugin. Once integrated with C++ Builder, you can take memory snapshots and analyze leaks while debugging, without leaving the IDE.
Deleaker can be used as a plugin with all versions of C++ Builder starting from C++ Builder 2010. If you are using C++ Builder 6.0, use Deleaker Standalone to detect leaks.
The Deleaker installer automatically detects installed versions of C++ Builder and integrates the plugin into the supported ones.
After installation, start RAD Studio. A new Deleaker menu item will appear in the main menu. To open the Deleaker window, select Deleaker -> Deleaker Window.
By default, Deleaker is enabled and ready to profile memory leaks. To enable or disable Deleaker, use Deleaker -> Enabled.
Introducing a memory leak
Create a new Windows VCL Application, place a button on the form, and add a leak in the OnClick event handler:
void __fastcall TForm1::Button1Click(TObject *Sender)
{
    int* p = new int[1024];
}
Project setup
Although Deleaker can profile any application regardless of how it was built, configuring the project properly helps obtain more accurate and detailed results.
Debug information
Enabling debug information is essential. Debug information allows Deleaker to resolve addresses and determine the source file path and line number for each allocation.
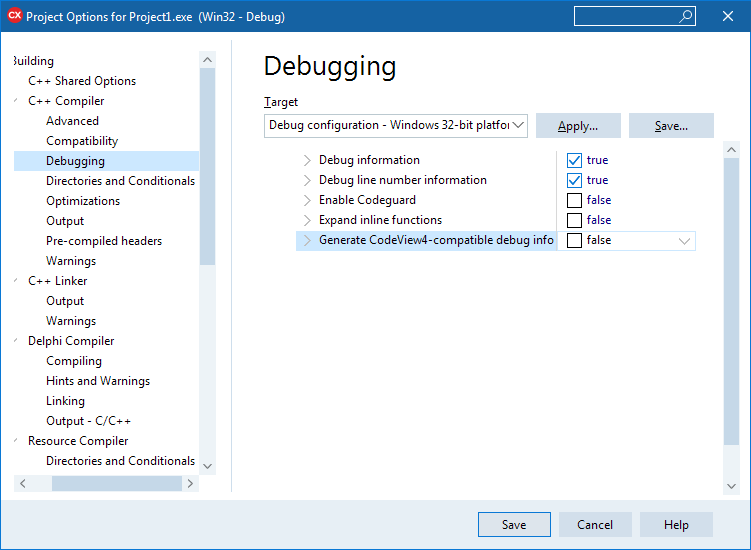
To enable debug information, open Project -> Options..., then navigate to C++ Compiler -> Debugging and set both Debug information and Debug line number information to True.
It is also recommended to ensure that Enable CodeGuard is set to False.

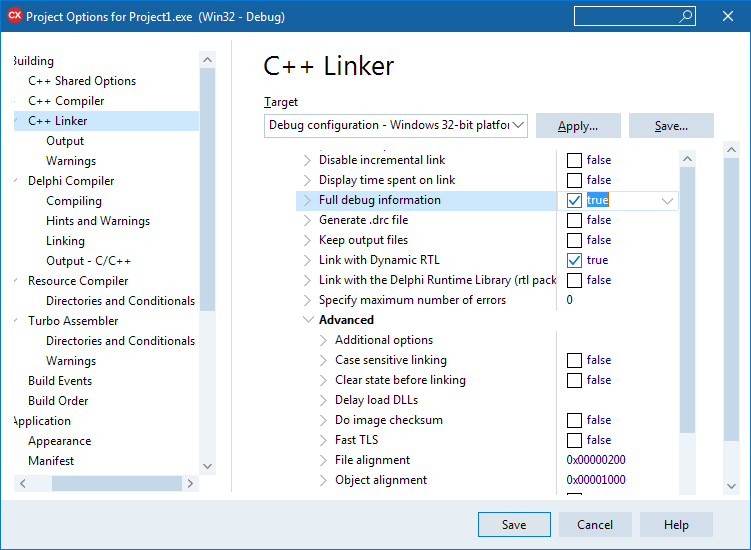
To enable full debug information in the linker, open C++ Linker and set Full debug information to True.

When building from the command line, use the compiler switches -v and -y.
Stack frames
When memory is allocated, Deleaker hooks allocation functions and records the call stack. To obtain complete call stack information, stack frame generation must be enabled.
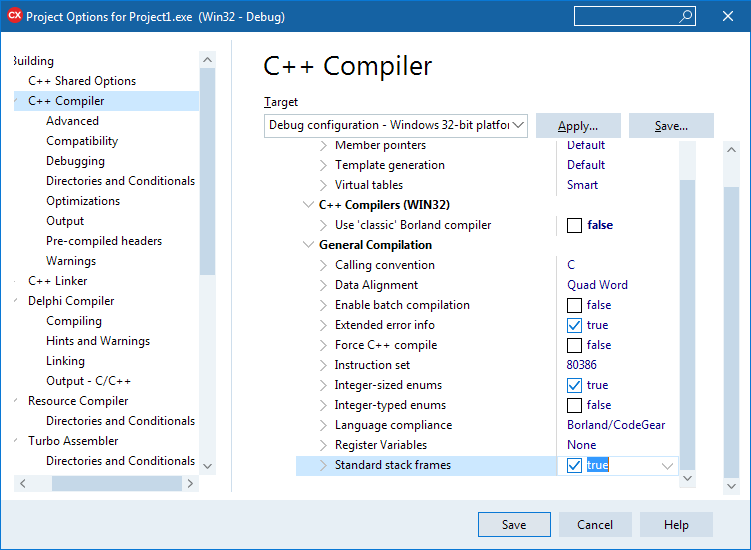
Enable stack frames by opening C++ Compiler -> General Compilation and setting Standard stack frames to True.

When building from the command line, use the compiler switch -k.
Disable optimization
Although Deleaker can detect leaks in optimized builds, disabling optimizations produces more accurate and readable allocation information.
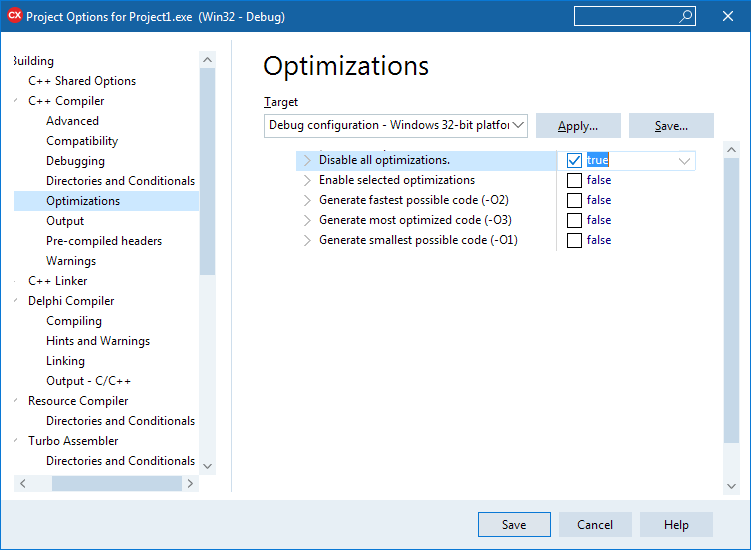
Open C++ Compiler -> Optimizations and set Disable all optimizations to True.

Get memory leaks
After configuring the project, build and run the application. Click the button to introduce the leak, then close the application.
If Deleaker is enabled, it automatically takes a snapshot when the process exits. This snapshot contains all allocations that were not freed. Such allocations are considered memory leaks.
To navigate to the code responsible for a leak, double-click an allocation entry or right-click a call stack entry and select Show Source Code. The corresponding source file opens in C++ Builder at the exact line where the leak occurred.
Fixing permanent memory leaks
In some cases, a process continuously consumes more and more memory. This often indicates code paths that repeatedly allocate memory without releasing it.
You can monitor memory usage directly in the Deleaker window by switching to the Resource Usage Graph during debugging.
To simulate a permanent leak, add a timer to the form, enable it, set the interval to 500 ms, and allocate memory in the OnTimer event:
void __fastcall TForm1::Timer1Timer(TObject *Sender)
{
    int* p = new int[1000000];
}
Build and run the application. While it is running, open the Deleaker window and click Take Snapshot. Examine the Hit Count column, which shows how many allocations were made at the same call stack.
A high Hit Count indicates repeated allocations at the same location and helps identify permanent leaks.
Another approach is snapshot comparison. Take two snapshots at different points in time and compare them to view only allocations that appeared between the snapshots.
VCL object leaks
C++ Builder applications frequently create and use VCL objects. These objects must be explicitly destroyed, and it is easy to forget to free them.
As a result, VCL object leaks are one of the most common leak types in C++ Builder applications.
Deleaker provides a dedicated view for such objects. Switch to the Delphi Objects tab to inspect them.
Objects are grouped by class. For each object, a full call stack is available. For each class, the total number of created objects and their combined size are displayed, making it easy to identify problematic classes.
You can quickly locate objects of a specific class by typing its name in the Filter by name field.
Conclusion
Detecting memory leaks is a challenging task, even in well-written code that follows modern C++ practices. Applications written in C++ Builder often rely on VCL objects, which require explicit lifetime management and are therefore prone to leaks.
A memory profiler such as Deleaker is an essential tool for identifying and fixing such issues.
Deleaker integrates tightly with C++ Builder and provides an efficient way to inspect allocated memory, VCL objects, and GDI resources. As a universal memory leak detection tool, Deleaker supports both 32-bit and 64-bit applications and works with modern frameworks such as FireMonkey as well as traditional VCL applications.