Visual Studio memory leak detection with Deleaker
Enabling and disabling Deleaker
Deleaker is tightly integrated into Visual Studio as a native extension. When a process is being debugged, the Deleaker window opens automatically.
If the Deleaker window is not visible, open it manually via Extensions -> Deleaker -> Deleaker Window in the Visual Studio main menu:
By default, Deleaker attaches to every process being debugged in Visual Studio. In some scenarios, memory profiling is not required.
To temporarily disable Deleaker:
- Uncheck Enable Deleaker in the Deleaker window, or
- Open Deleaker -> Options and set Monitor Leaks to False in the Settings section

Taking snapshots during debugging
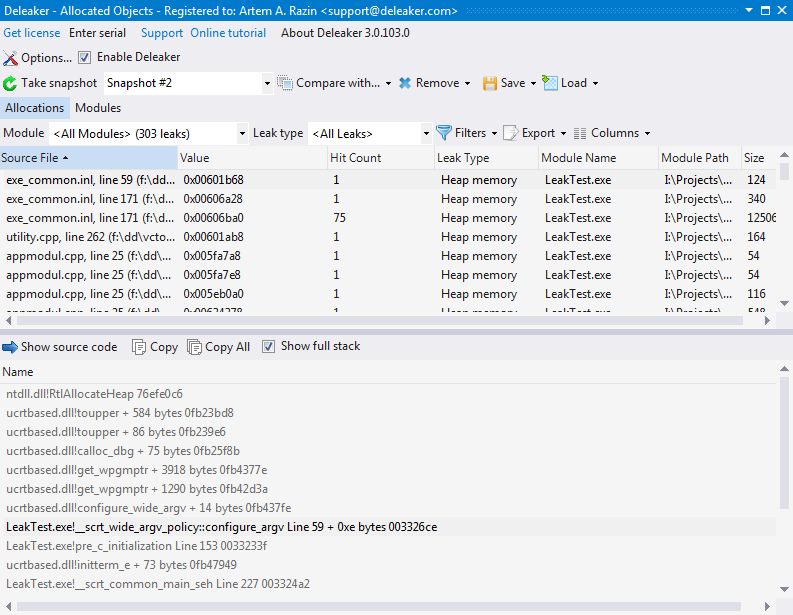
Enable Deleaker and start debugging as usual. At any time, you can open the Deleaker window and click Take Snapshot to capture all currently allocated resources.
An allocation is any resource that may leak if it is allocated but not freed, including:
- memory blocks
- handles
- GDI objects
- synchronization primitives
When you take a snapshot, Deleaker displays a progress dialog while collecting data. Once finished, the allocation list is shown, including details such as:
- allocation value
- source file and line number (if available)
- leak type
- module information

When the debugged process exits, Deleaker automatically takes a final snapshot containing all allocations that were not freed.
Debugging .NET applications
Deleaker can detect both unmanaged and managed memory leaks in .NET applications. For example, if managed code calls native C++ DLLs, Deleaker is able to detect leaks originating from those native components.
Unmanaged code debugging must be enabled in the project settings. Without it, Deleaker cannot attach to the debugged process.
Understanding snapshots
Every allocation list collected by Deleaker is automatically saved as a snapshot. Snapshots can be revisited later and compared with each other.
Comparing snapshots is one of the most effective ways to locate memory leaks. This is described in detail in the Snapshots section below.
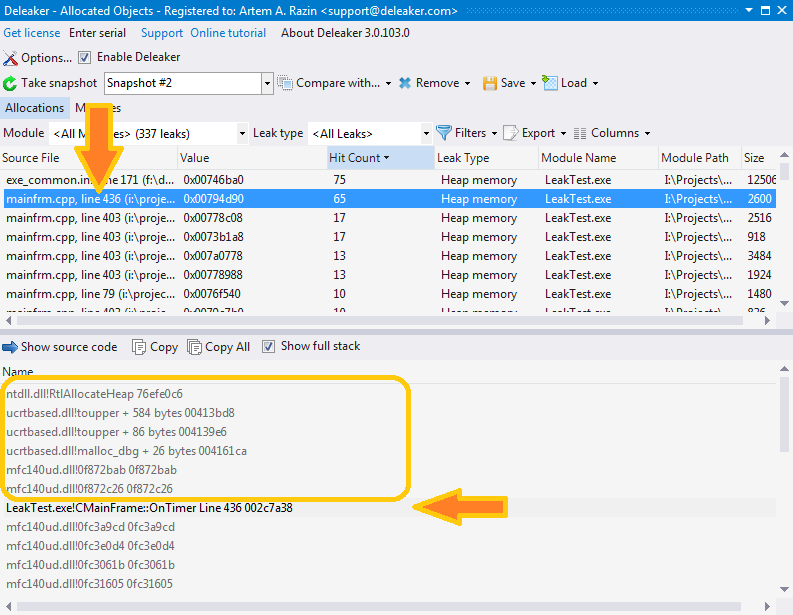
Another quick technique is sorting allocations by Hit Count. A high Hit Count usually indicates repeated allocations from the same code location, which is often a sign of a leak.
Filtering leaks by type
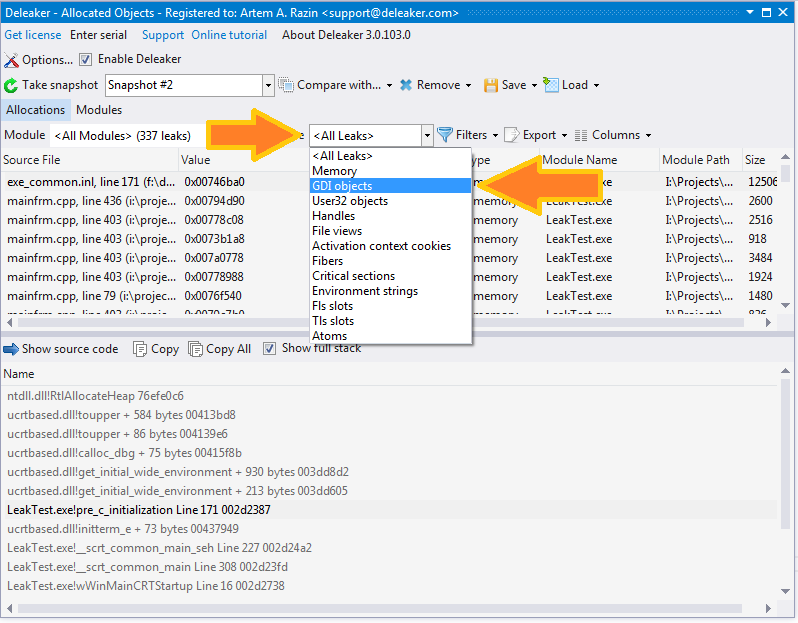
By default, Deleaker shows leaks of all types. If you are investigating a specific resource category, you can filter the list.
Use the Leak Type combo box to display only:
- memory leaks
- GDI leaks
- handle leaks
- or any other supported resource type

Filtering leaks by module
Another powerful filter is Module. The module is the logical owner of an allocation - the module whose code caused it.
Determining the owning module is not always trivial. For example:
- your executable calls
new newis implemented in a runtime library- the runtime library eventually calls
HeapAllocinkernel32.dll
Although HeapAlloc is called from a system DLL, the allocation logically belongs
to your executable.

Deleaker treats runtime and framework libraries as intermediate modules. While analyzing a call stack, Deleaker skips intermediate modules and identifies the real caller module that initiated the allocation.
The list of intermediate modules can be configured in Options -> Settings.
Filtering by module allows you to quickly distinguish allocations made by your code from those originating in third-party or system libraries.
Analyzing call stacks
Select an allocation to view the call stack captured at the moment of allocation. This stack trace is the key to understanding where a leak originates.
Deleaker provides two stack views:
- Full stack - includes all stack frames
- Short stack - shows only frames with source code information
Use the Show full stack button to switch between these views.
Note that source file references may exist even if the file is not present locally. This information comes from debug symbols. Double-click a stack frame to open the corresponding source file in Visual Studio (if available) and navigate to the exact line of code.
Snapshots comparison
Snapshots are primarily intended for comparison.
Consider a case where the number of GDI objects constantly increases. You take a snapshot:

After some time, you take another snapshot:

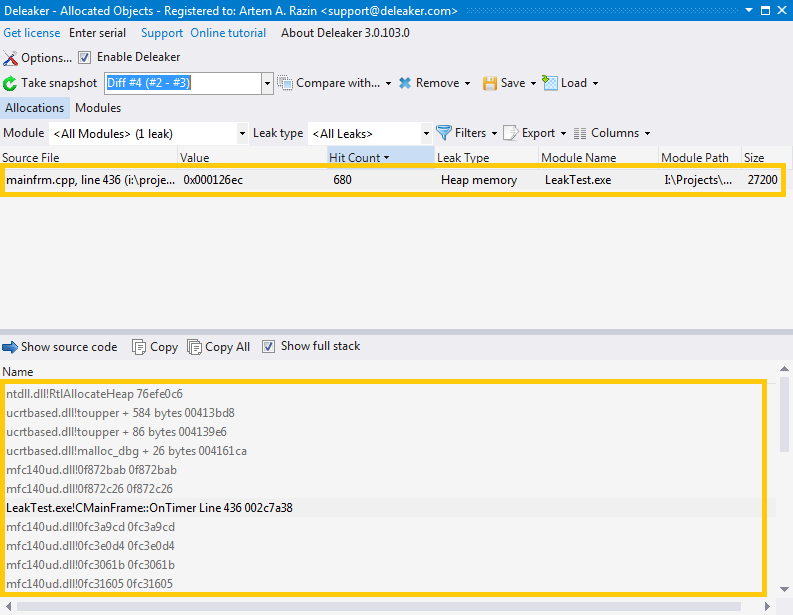
To find the leak, select the first snapshot and then choose the second one using Compare with...:

Deleaker displays only allocations that are present in the second snapshot but not in the first one - these are newly allocated resources.
Such allocations are strong candidates for memory or resource leaks and should be investigated carefully.
